2023 Commodity Enterprise Budgets & Break-Even
go.ncsu.edu/readext?905494
en Español / em Português
El inglés es el idioma de control de esta página. En la medida en que haya algún conflicto entre la traducción al inglés y la traducción, el inglés prevalece.
Al hacer clic en el enlace de traducción se activa un servicio de traducción gratuito para convertir la página al español. Al igual que con cualquier traducción por Internet, la conversión no es sensible al contexto y puede que no traduzca el texto en su significado original. NC State Extension no garantiza la exactitud del texto traducido. Por favor, tenga en cuenta que algunas aplicaciones y/o servicios pueden no funcionar como se espera cuando se traducen.
Português
Inglês é o idioma de controle desta página. Na medida que haja algum conflito entre o texto original em Inglês e a tradução, o Inglês prevalece.
Ao clicar no link de tradução, um serviço gratuito de tradução será ativado para converter a página para o Português. Como em qualquer tradução pela internet, a conversão não é sensivel ao contexto e pode não ocorrer a tradução para o significado orginal. O serviço de Extensão da Carolina do Norte (NC State Extension) não garante a exatidão do texto traduzido. Por favor, observe que algumas funções ou serviços podem não funcionar como esperado após a tradução.
English
English is the controlling language of this page. To the extent there is any conflict between the English text and the translation, English controls.
Clicking on the translation link activates a free translation service to convert the page to Spanish. As with any Internet translation, the conversion is not context-sensitive and may not translate the text to its original meaning. NC State Extension does not guarantee the accuracy of the translated text. Please note that some applications and/or services may not function as expected when translated.
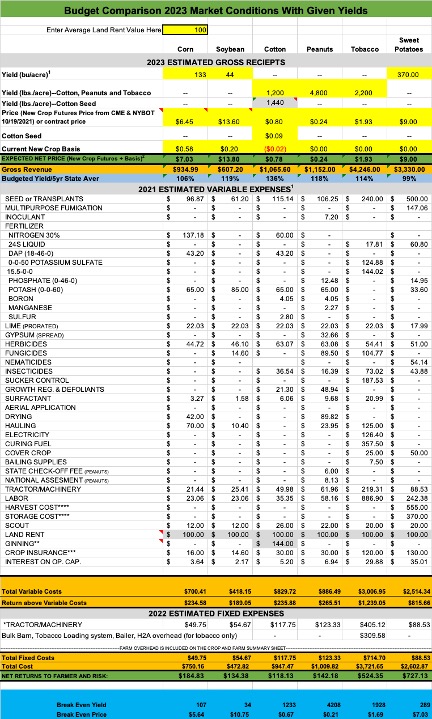
Collapse ▲Assuming an average county yield and current commodity price, what crop will provide the greatest return on investment in 2023 if one is considering tobacco, corn, soybean, cotton, sweet potato or peanut production? Which has the highest probability of obtaining the 3 or 5 year average yield? Which relates to the greatest capital loss should disaster occur? These are simply a few questions each producer must evaluate prior to planting. To do so, one must establish an enterprise budget based upon the best projections.
Following within this article are budgets for each crop. Realize several key points when reviewing this data. First, to be truthful, each budget is probably a bit higher than most will realize. In part, this is due to the fact that these budgets assume the greatest input. As such, soil fumigants, fungicide use, professional scouting, maximum crop insurance, and other expense are included. Every grower may not utilize all of these inputs. Thus, removal of any one of these items from the budget will decrease expenses to realize greater profit. Secondly, exact increase in price, if any, for inputs in 2023 are not known. Market demand, energy price increases, or even a country’s trade policies can greatly influence these prices. For these reasons, each producer should utilize their own budget projection to determine how closely these figures match. Lastly, when posting to the web, it is better to over-estimate values rather than under estimate them. If inflated values used in evaluation and discussion provide profit, then any reduced value simply adds additional profit.
So, back to the original questions. If one chooses tobacco based on historic profitability, then one assumed incorrectly. Tobacco production actually is for a loss. In order of decreasing return of investment, crops with profit are sweet potato, peanut, corn, soybean and cotton. However, profit is not the only criteria for crop selection. Consider disaster loss as example and the decision become a bit more complex. Sweet potato production expenses are a bit over $2,600 per acre but probability of reaching average yield is probably about 75%. Corn provides profit of a bit over $184/ac with an investment of $750/ac yet has only about an 70% probability of reaching average yield. As such, cotton with an investment of $947/ac returns $118/ac with 92% probability of reaching average yield. However the additional $197/ac required for cotton compared to corn could be significant on 1000 acres of production should disaster occur. Consideration of loss should be evaluated along with current capital for recovery. Such an evaluation will also impact planning and production.
These examples simply reflect the difficulty many producers face when weighing economic considerations with other factor such as available labor, projected climate, current market demand, regulations and more. There is never one easy answer. Fortunately, NC Extension has the means to aid evaluation. Data presented within this article utilized the NC State Crop Comparison Tool. This tool afford the opportunity to compares cost of each enterprise by changing each crop input, yield, price, fixed cost. The tool also utilizes this data to project profit based on inflationary price increases. A separate tab projects total farm income or loss based upon acres of crops selected to produce. Lastly, the tool include a quick reference of state and regional crop yields. It is suggested that each grower examine this tool. If assistance is needed, contact your local NC Extension office.
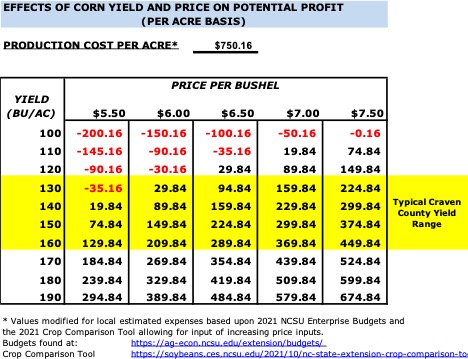
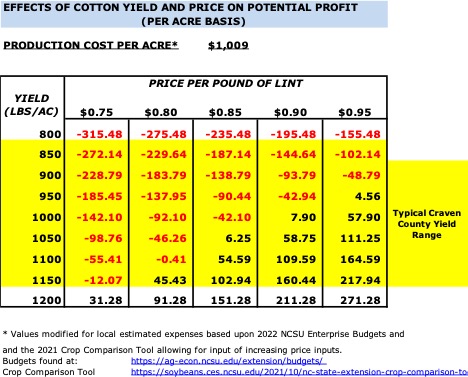
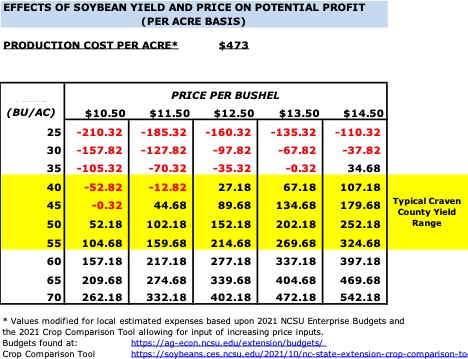
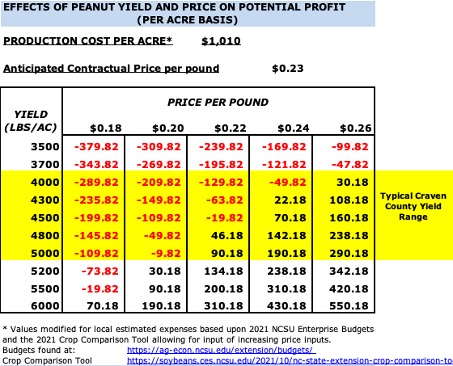
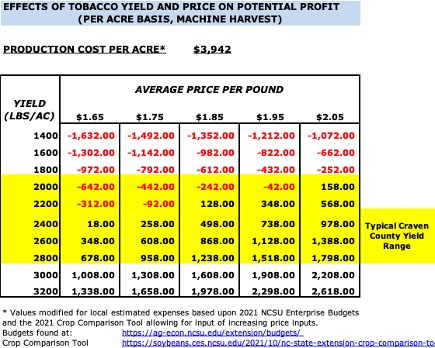
In spite of careful planning, often sudden price declines impact profitability of crops. Thus, it is feasible to examine data for variable prices and yield. The charts below utilize the total cost of production established to review changes in profit/loss with variable yield and commodity price. Yellow highlighted yield range signifies typical yield within Craven County. Having thus said, recent changes in breeding, better management practices, and changes in technology have resulted in increasingly higher corn and soybean yield.


