How to Deal With Corn and Changing Weather Patterns
go.ncsu.edu/readext?855452
en Español / em Português
El inglés es el idioma de control de esta página. En la medida en que haya algún conflicto entre la traducción al inglés y la traducción, el inglés prevalece.
Al hacer clic en el enlace de traducción se activa un servicio de traducción gratuito para convertir la página al español. Al igual que con cualquier traducción por Internet, la conversión no es sensible al contexto y puede que no traduzca el texto en su significado original. NC State Extension no garantiza la exactitud del texto traducido. Por favor, tenga en cuenta que algunas aplicaciones y/o servicios pueden no funcionar como se espera cuando se traducen.
Português
Inglês é o idioma de controle desta página. Na medida que haja algum conflito entre o texto original em Inglês e a tradução, o Inglês prevalece.
Ao clicar no link de tradução, um serviço gratuito de tradução será ativado para converter a página para o Português. Como em qualquer tradução pela internet, a conversão não é sensivel ao contexto e pode não ocorrer a tradução para o significado orginal. O serviço de Extensão da Carolina do Norte (NC State Extension) não garante a exatidão do texto traduzido. Por favor, observe que algumas funções ou serviços podem não funcionar como esperado após a tradução.
English
English is the controlling language of this page. To the extent there is any conflict between the English text and the translation, English controls.
Clicking on the translation link activates a free translation service to convert the page to Spanish. As with any Internet translation, the conversion is not context-sensitive and may not translate the text to its original meaning. NC State Extension does not guarantee the accuracy of the translated text. Please note that some applications and/or services may not function as expected when translated.
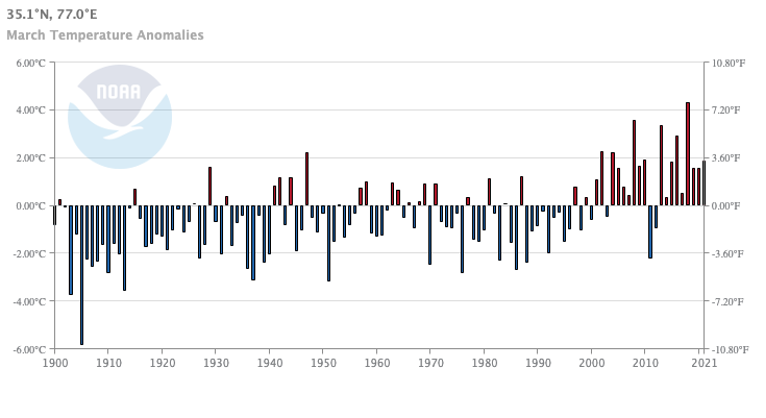
Collapse ▲Examining the data from NOAA, notice that just prior to 2000, March temperatures have been much warmer. Too, according to the NC Climate Service Report, the frequency of rainfall events greater than 3.0 inches has increased. Lastly, annual precipitation has increased due to increasing frequency of rainfall events and/or greater number of tropical storm systems. All of these factors need to be considered when selecting a corn planting date since stress during reproduction stages can be the most detrimental to yield.

Source: NOAA March Anomaly
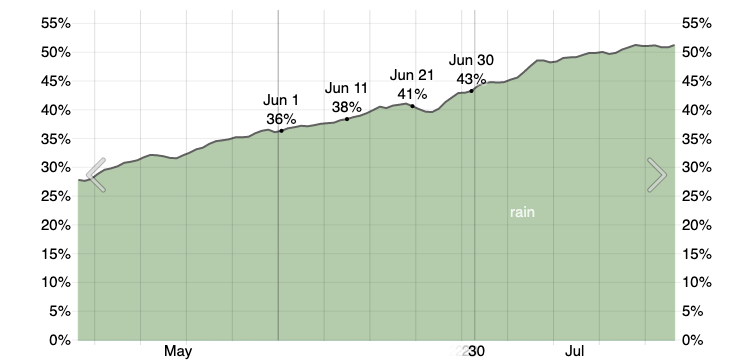
Ideally, corn should be planted when the three to four day forecast predicts accumulation of 100-125 Growing Degree Days (GDD). Once emerged it typically takes 1200-1600 GDD, depending upon the hybrid maturity, to reach reproductive stage. Assuming the midrange of 1400, one can examine the probability of adverse events at the time of early reproductive stages. Note that historical data for this area shows low probability of rainfall from about June 1st through June 30th when corn is likely to begin reproductive stages. So, the best one can do is aim to avoid beginning of tassel during the lowest probability of rainfall. One way to do so is to match the maturity date for corn to an appropriate planting date.

Probability of Rainfall: Source: Weatherspark.com/
One tool that will assist is the NC State Corn Climate Dashboard. Entering a planting date of April 4th shows that reproductive stage (1400 GDD) will occur on June 17th. This corresponds with a period of higher probability of rainfall just prior to tassel emergence as well as during pollination. A brief, lower probability period of rainfall has historically been observed shortly thereafter and an increasing probability of rainfall for July and August. In contrast, selecting a planting date of April 18th shows reproductive stage to occur on June 22nd, a time of much lower probability of rainfall and excessively high temperatures.
Using this example, one can at least increase the probability of successful production simply by avoiding planting dates results in corn reproduction stages coinciding with the lowest probability of rainfall. Oddly, this avoidance of stressful climatic conditions can also be accomplished by a later planting date. Note that a May 10th planting date results in early reproductive stages occurring near July 4th when the probability of rainfall dramatically increases. For the later planting date, some decrease in yield may be observed. However this decrease is yield is far less than one would experience if plants tassel during heat and drought stress.
To look a bit more closely at the predictions of this tool, examine yield and weather patterns over the past few years. In 2020 and 2021, corn yield was excellent. In fact, 2021 set new corn yield records in NC. Note that in these years, frequent rainfall events occurred May through about June 20th, then frequency of rainfall decreased until about July 4th. So, while corn did indeed experience some heat/drought stress, it was after silk and tassel stages were completed. In contrast, data for 2016 & 2018 show similar result with ample rainfall in May but a lack of rainfall from early through mid-June when these reproductive stages occurred. The primary point is that while we do not have the ability to accurately precisely predict rainfall events in the future, we do have tools that predict the highest possibility of occurrence. Use these tools to increase odds of success!

Rainfall for May-July 2021 Source: Weatherspark.com

Rainfall for May-July for 2018 Source: Weatherspark.com
Another feature of this tool is that the GDD accumulation rate is also provided. While rainfall patterns or indeed critical, so are night temperatures. As such, one can compare historical GDS accumulation to the current trends. As stated earlier, no prediction tool can ensure success all the time. However, using this tool and pairing early reproductive stages to coincide with the least probability of adverse conditions will increase chances of success.


