

2017 Diagnostics Lab Review
go.ncsu.edu/readext?604114
en Español / em Português
El inglés es el idioma de control de esta página. En la medida en que haya algún conflicto entre la traducción al inglés y la traducción, el inglés prevalece.
Al hacer clic en el enlace de traducción se activa un servicio de traducción gratuito para convertir la página al español. Al igual que con cualquier traducción por Internet, la conversión no es sensible al contexto y puede que no traduzca el texto en su significado original. NC State Extension no garantiza la exactitud del texto traducido. Por favor, tenga en cuenta que algunas aplicaciones y/o servicios pueden no funcionar como se espera cuando se traducen.
Português
Inglês é o idioma de controle desta página. Na medida que haja algum conflito entre o texto original em Inglês e a tradução, o Inglês prevalece.
Ao clicar no link de tradução, um serviço gratuito de tradução será ativado para converter a página para o Português. Como em qualquer tradução pela internet, a conversão não é sensivel ao contexto e pode não ocorrer a tradução para o significado orginal. O serviço de Extensão da Carolina do Norte (NC State Extension) não garante a exatidão do texto traduzido. Por favor, observe que algumas funções ou serviços podem não funcionar como esperado após a tradução.
English
English is the controlling language of this page. To the extent there is any conflict between the English text and the translation, English controls.
Clicking on the translation link activates a free translation service to convert the page to Spanish. As with any Internet translation, the conversion is not context-sensitive and may not translate the text to its original meaning. NC State Extension does not guarantee the accuracy of the translated text. Please note that some applications and/or services may not function as expected when translated.
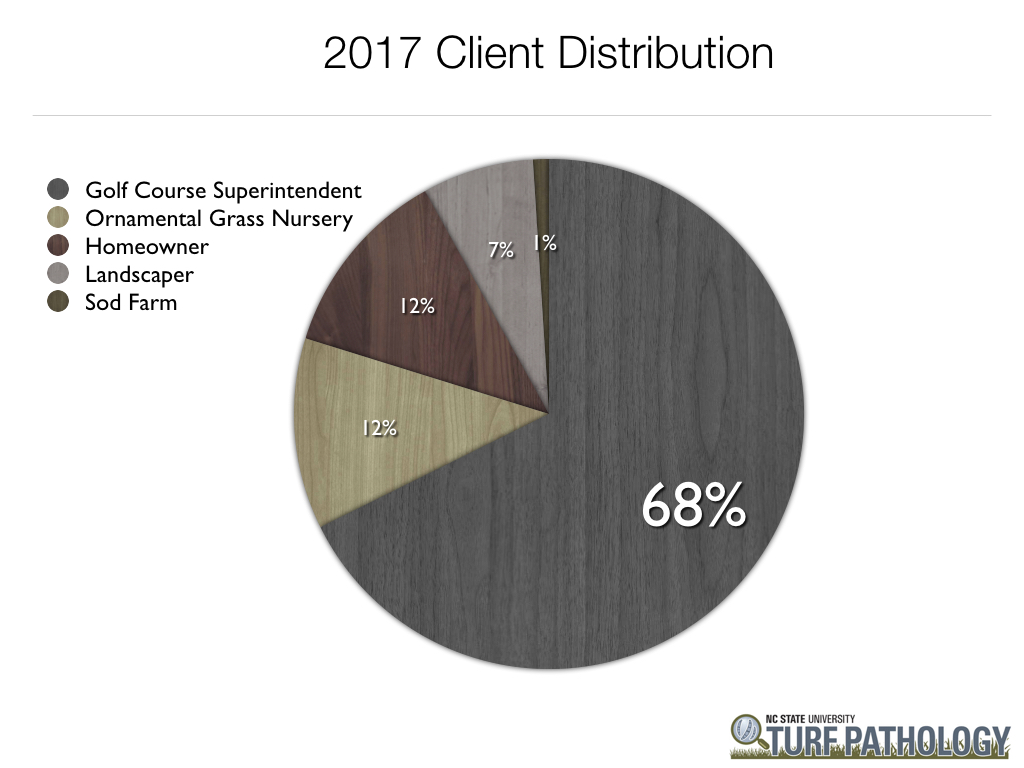
Collapse ▲Overall, turfgrass samples submitted to the NC State Turf Diagnostics Lab were up by 9% when compared to 2016. As expected, the majority (68%) of our samples came from golf course putting greens. Creeping bentgrass putting green samples were down 39% while bermudagrass putting green samples were up 54% when compared to 2016. Below you will find information regarding all golf course putting green samples submitted in 2017. Enjoy!
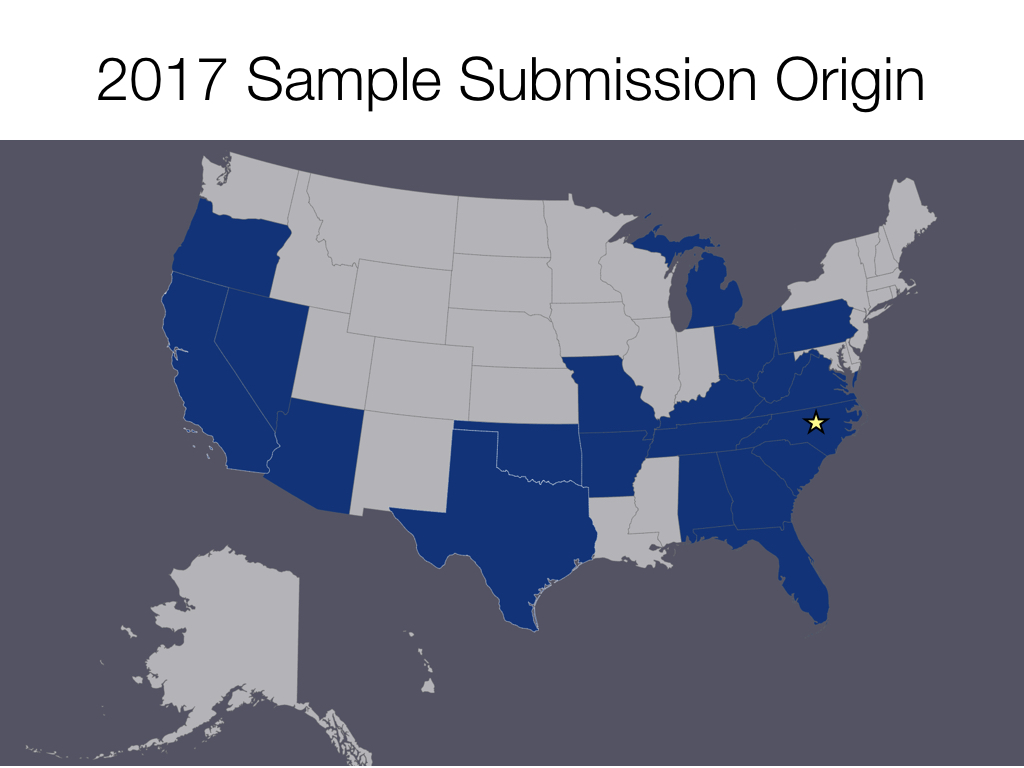
WARNING! – These charts only indicate the samples we have received in our lab here at NC State. While we do receive samples from various regions of the country, the majority (~80%) of creeping bentgrass and bermudagrass putting green samples come from the southeastern United States. The following post covers data collected from all golf course putting green samples.
We typically only receive samples from cases that are very hard to diagnose in the field alone. Simply put, we get the funky stuff! Therefore these charts don’t necessarily represent the major disease outbreaks, but illustrate what causes the most head scratching if you will.
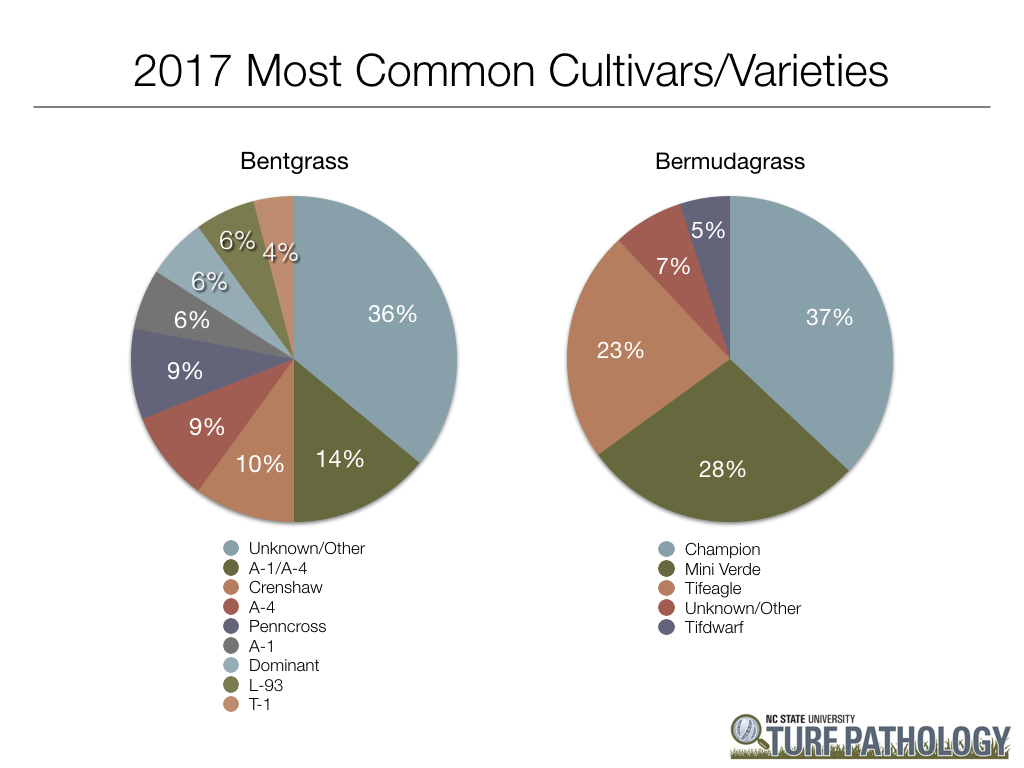
First, let’s take a look at which cultivars and varieties we receive the most. This is NOT an indication of one being more susceptible to disease or problematic than another. This was compiled from all samples submitted in 2017 and would likely match any survey that asks “What do you have planted?”. Remember, we receive most of our samples from the southeastern US with the majority of those coming from right here in North Carolina.
Next, let’s take a look at actual disease diagnoses. If you remember from an earlier post, the majority of the time we do not find any active disease causing organisms in samples. This could be due to any number of factors such as it never was a disease, it was a disease and the damage was done too long ago to detect, or it was a disease and you’ve suppressed it with your fungicide program. I’m looking right at you folks who send samples after spraying everything in the barn BEFORE you take your samples!
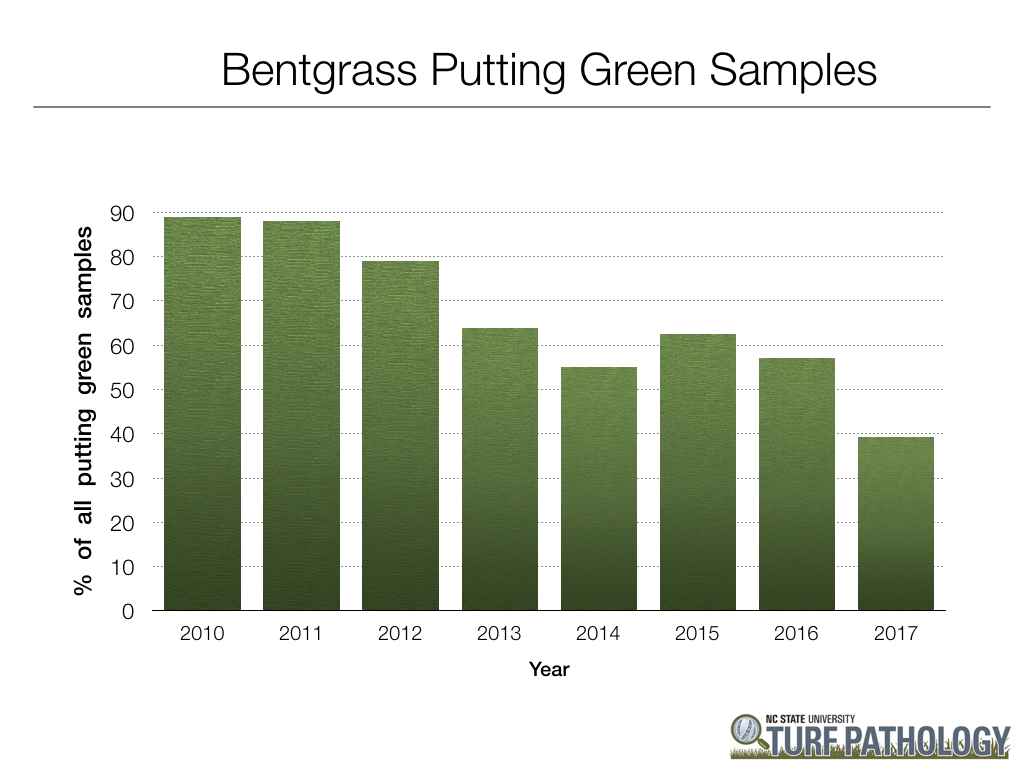
As expected with the industry shifting more towards ultra-dwarf bermudagrass putting greens, creeping bentgrass samples continue to decline. For the first time ever, we received more bermudagrass samples than creeping bentgrass samples.
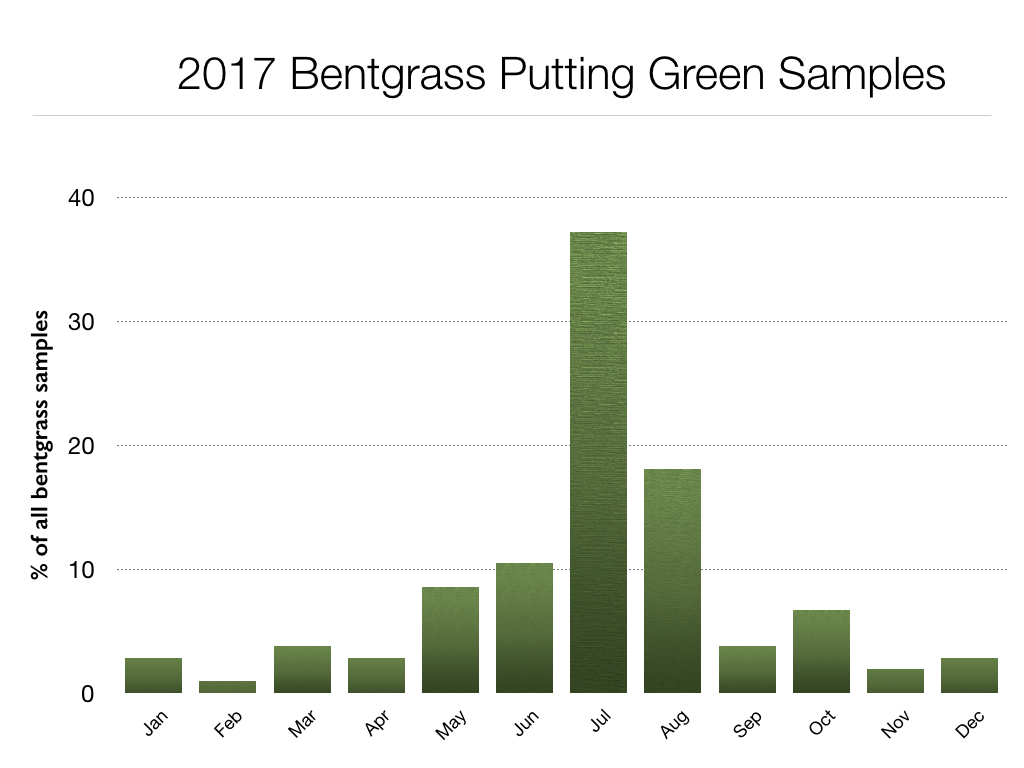
For the most part, creeping bentgrass samples followed the same trends we observed in 2016. The yearly chart above is usually about the same with the majority of samples coming during periods of stress between June and August as it always has been since we started tracking this information back in 2008.
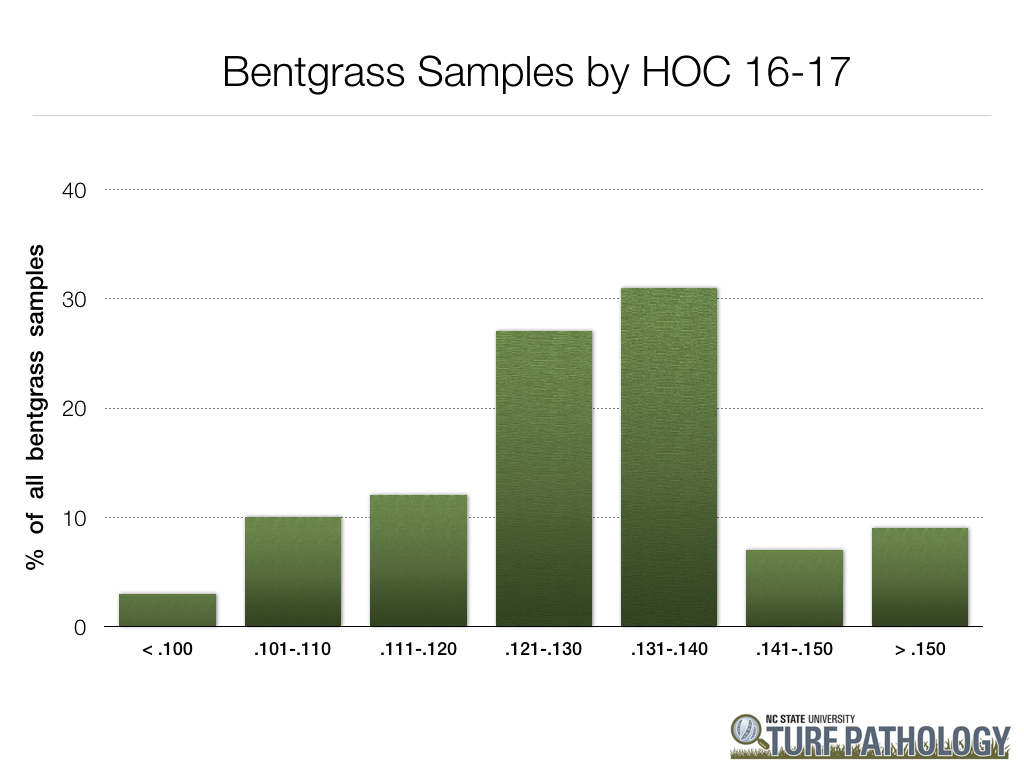
At the request of some folks, we decided to go back and look at height of cut (HOC) for all creeping bentgrass sample submissions to see if there were any trends over the past couple of years. This is what was reported on the sample submission forms with no indication as to whether these were bench heights or actual heights. Regardless, you can see that the majority of samples are being mown below 0.140″. In general, it seems most are willing to raise heights during stressful periods, but fewer growers are willing to go above 0.140″.
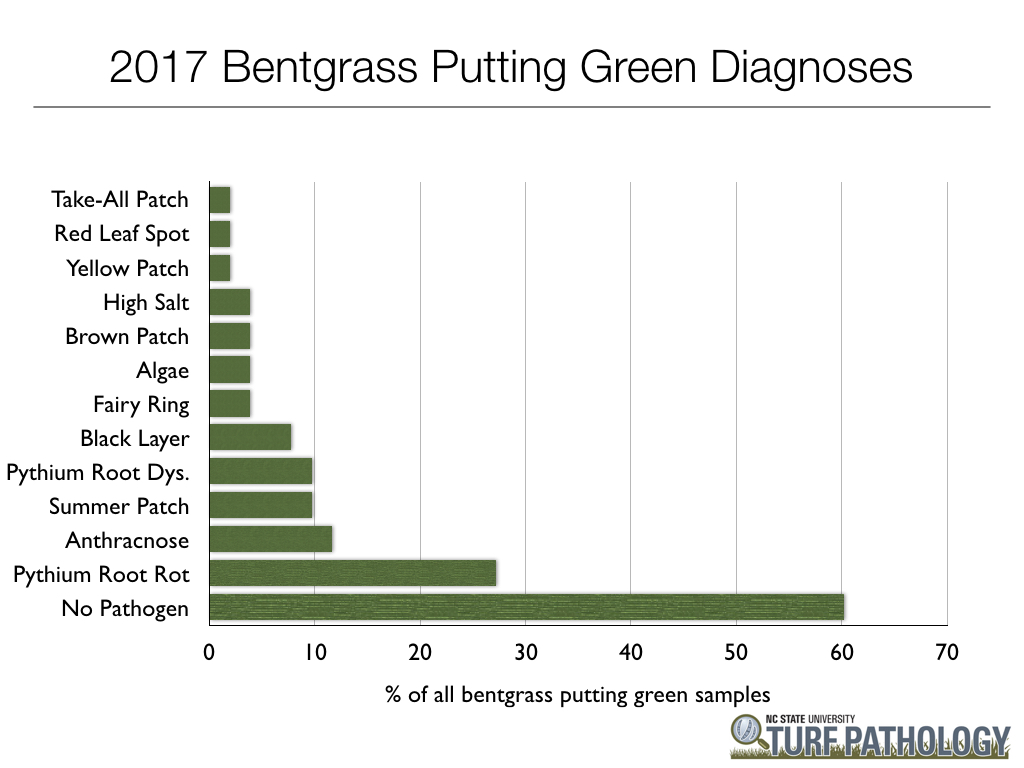
Now, think about all of the problems listed in the bar graph above. With the exception of summer patch and fairy ring when they create nice little rings, they can all look similar! It’s very hard to diagnose most of these biotic and abiotic diseases in the field with 100% accuracy without looking under a microscope or testing for high salt levels. Once again, remember that rarely do growers send us samples of things like fairy ring, brown patch, dollar spot, etc. that are relatively easy to diagnose in the field. Also, receiving a diagnosis of “no disease” is equally as valuable as receiving a disease diagnosis. There are lots of things that cause turfgrass quality to decline, don’t assume it has to be a disease.
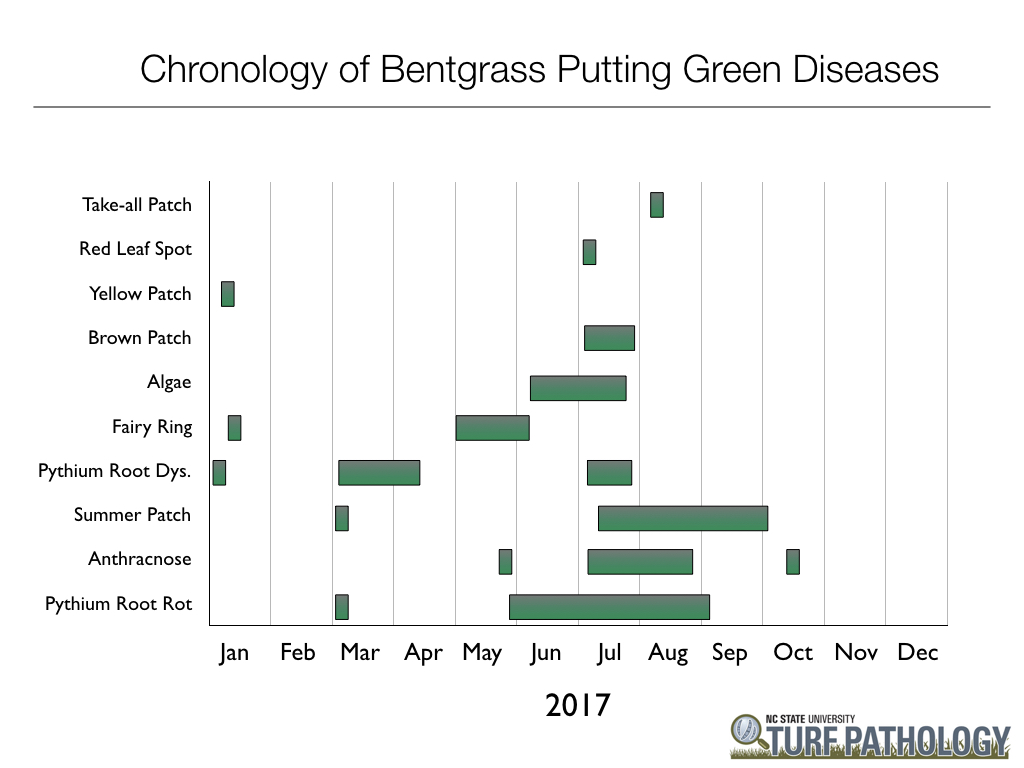
The chart above shows when each disease was diagnosed for creeping bentgrass putting green samples. While most diseases occur when expected, you can clearly see that sometimes diseases appear unexpectedly due to short-term atypical weather patterns. A good example of this would be the several Pythium root rot and summer patch diagnoses in early March.
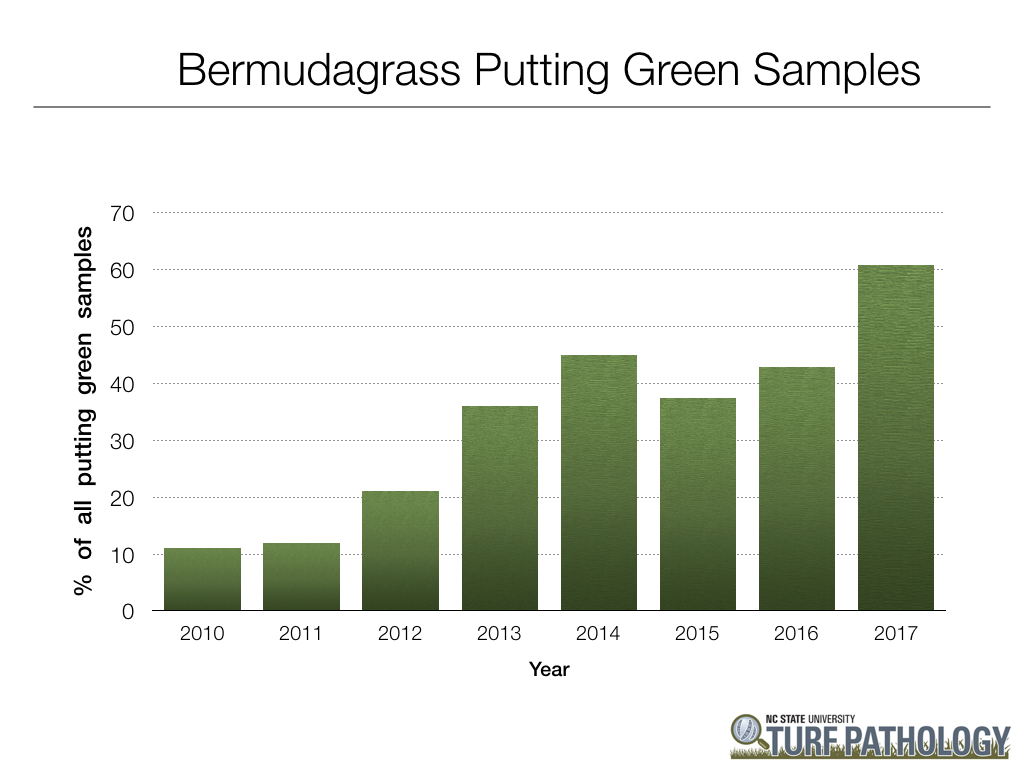
While this is the inverse of the creeping bentgrass chart above, this graph shows the rise of bermudagrass putting green samples over the past several years due to the industry shift towards these grasses for putting green surfaces.
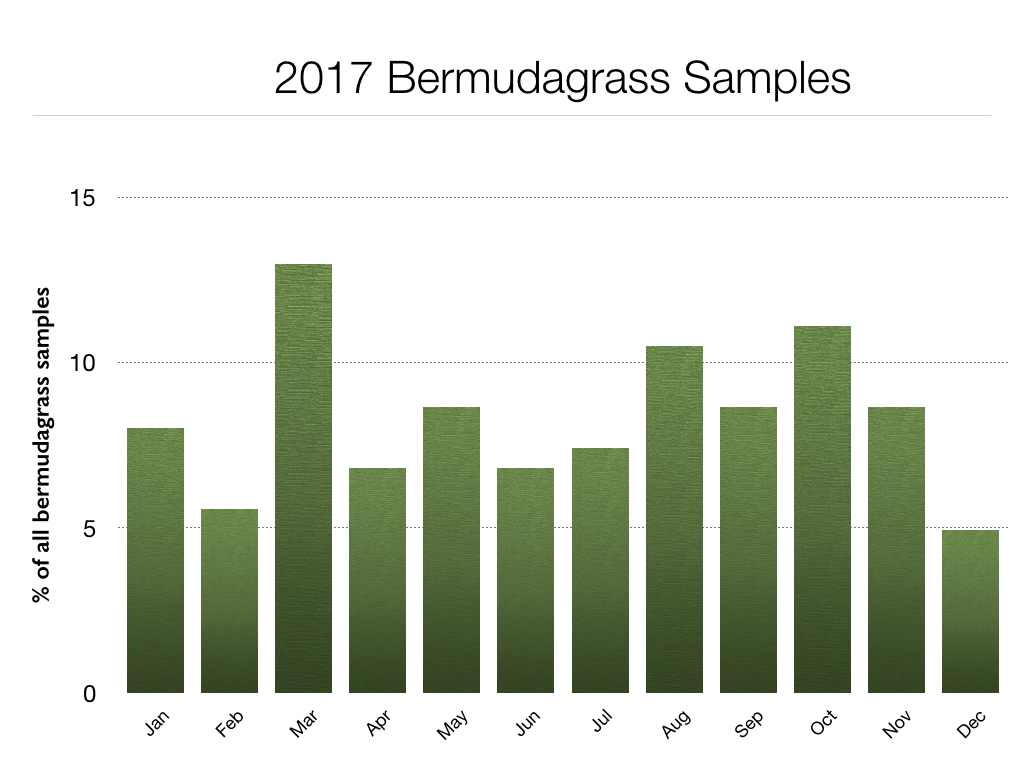
Just like the bentgrass chart, the bermudagrass chart follows a very similar path each and every year. The problems are fairly well distributed throughout the year with pikes in the spring and fall.
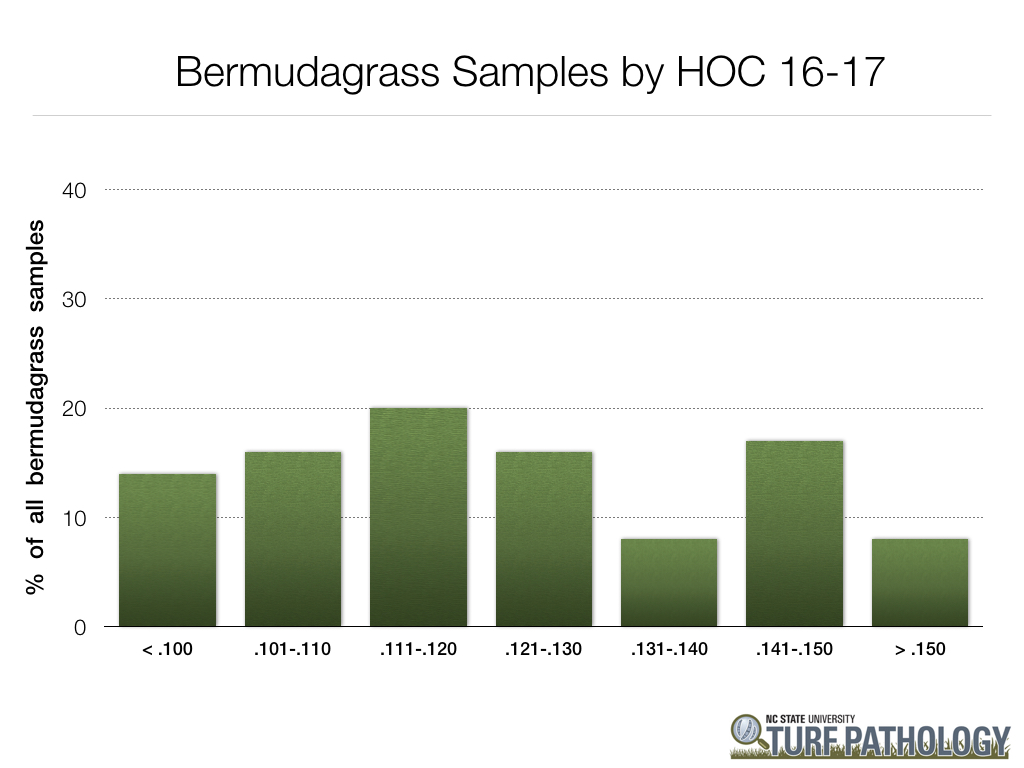
As with creeping bentgrass, we decided to go back and look at height of cut (HOC) for all bermudagrass sample submissions to see if there were any trends over the past couple of years. This is what was reported on the sample submission forms with no indication as to whether these were bench heights or actual heights. Regardless, you can see that the majority of samples are being mown below 0.130″, with a lot of samples below 0.110″.
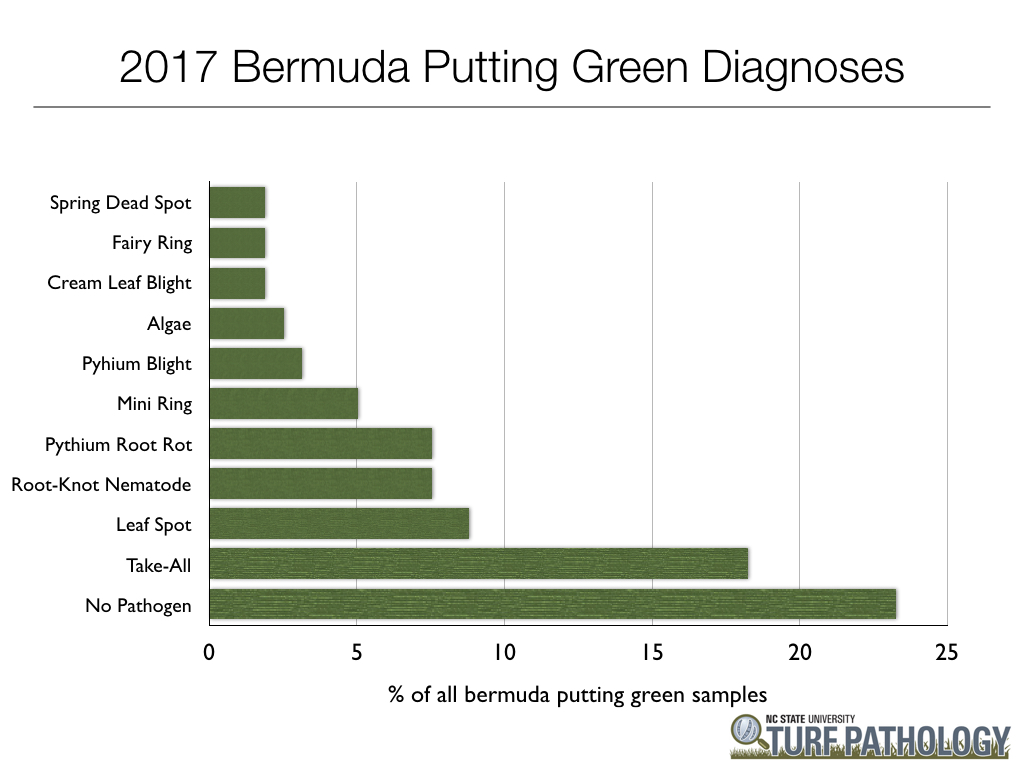
Just like in 2016, take-all root rot (a.k.a. bermudagrass decline) remains at the top of the list. We saw a significant increase in the occurrence of this disease starting in fall of 2015 when weather conditions were abnormally wet and warm for extended periods of time. Just like bentgrass diseases, a lot of these can look alike and require a microscope to make an accurate diagnosis. Our lab does not test for nematodes, however we will report root-knot nematodes when they are observed in high numbers because the attached females are very easy to see while all other nematodes go down the drain when we wash soil away from the roots for disease diagnosis.
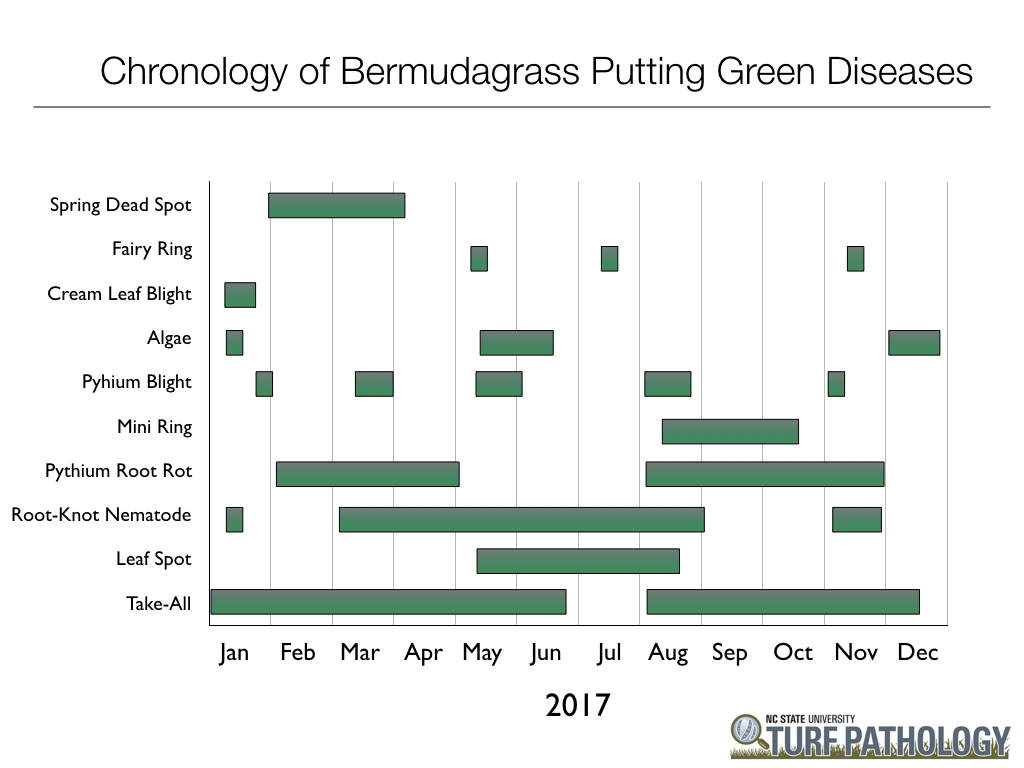
The chart above shows when each disease was diagnosed for bermudagrass putting green samples. While most diseases occur when expected, you can clearly see that sometimes diseases appear unexpectedly due to short-term atypical weather patterns. A good example of this would be the sporadic nature of Pythium blight that was most likely tied with wet periods in the regions from where those samples came from. Also, in most cases, take-all diagnoses from Jan – Jun were likely also observed the prior fall (2016) and symptoms came and went with the weather, cultural practices, etc.
Bottom line: As you can clearly see, both bentgrass and bermudagrass have their fair share of disease issues!